Power BI consulting and reporting automation

Turn Manual & Recurring Reporting Into Reliable Power BI Dashboards

NerdOrGeek helps growing businesses clean up Excel, QuickBooks, CRM, ERP, and operational reporting with focused Power BI dashboards, validated calculations, documentation, and practical handoff.

Start with one high-value reporting workflow, then expand into automation, training, and ongoing support as needed.

Fixed-scope dashboard pilotsPower BI, SQL, Excel, DAX and reporting automationDocumentation and handoff includedMonthly support available

The MVP offer

Start With One High-Value Reporting Workflow

Not every reporting problem needs a large analytics project. Start with one recurring report that matters. NerdOrGeek reviews the current workflow, builds a focused Power BI dashboard, validates the numbers, and documents the process so your team can use, maintain, and expand it.

Reporting Gap Pilot

A focused Power BI engagement for one recurring reporting workflow.

  • One current report or reporting workflow
  • 1-2 data sources
  • 1-3 Power BI report pages
  • Data cleanup and calculation review
  • Validation against current reports
  • Documentation and handoff
  • Optional Power BI Service deployment
  • Optional training session

Best Fit

  • Teams manually updating the same spreadsheet every week or month
  • Businesses with reporting spread across Excel, QuickBooks, CRM, ERP, or exports
  • Owners and managers who need clearer KPIs
  • Accounting, operations, inventory, dispatch, job-costing, sales, or finance reports
  • Businesses that want a practical first step before a larger reporting project

Problems and business outcomes

Has Your Business Outgrown Its Reporting Process?

Recurring reports often become harder to trust as the business grows, systems change, and spreadsheet work spreads across teams.

Someone is spending hours combining spreadsheets

Reduce recurring copying, cleanup, and consolidation work.

QuickBooks, Excel, CRM, or operations exports do not line up

Review data sources, calculations, and reporting logic.

Reports arrive after decisions have already been made

Give management clearer visibility before it is too late to act.

Important data is scattered across files, apps, and inboxes

Bring useful reporting information into one consistent view.

Reporting depends on one overloaded employee

Add documentation and reduce reliance on institutional knowledge.

Growth has made the current process difficult to maintain

Build a reporting foundation that can expand with the business.

Dashboard and industry use cases

Power BI Pilots for Reporting-Heavy SMBs

The best first project is usually not a massive analytics transformation. It is one recurring report that leadership already depends on.

Field Service and Contractors

Revenue, job status, labor, dispatch, estimates, invoices, and margin reporting.

Distributors and Operations Teams

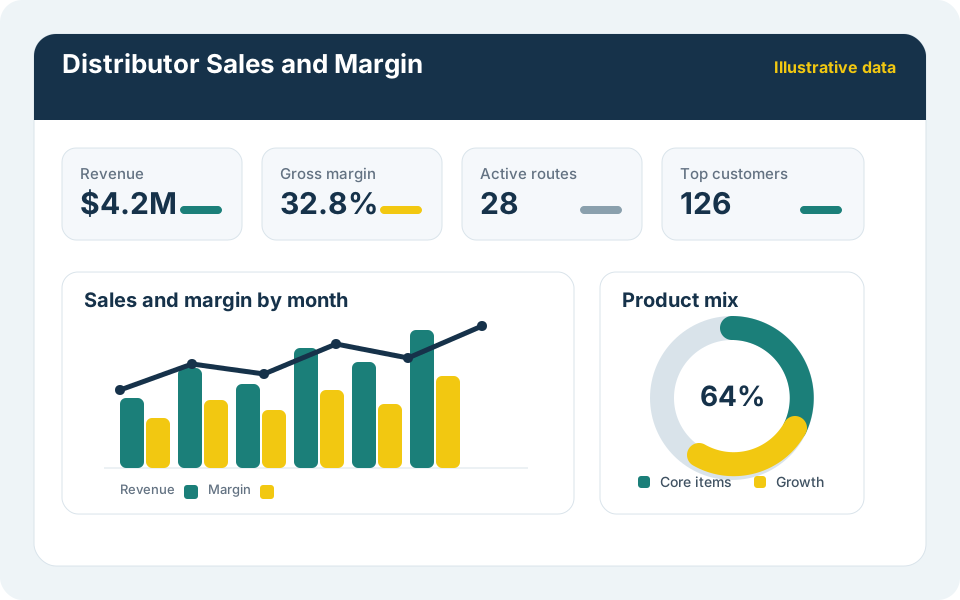
Sales, margins, customer, product, inventory, purchasing, and route reporting.

Accounting and Professional Services

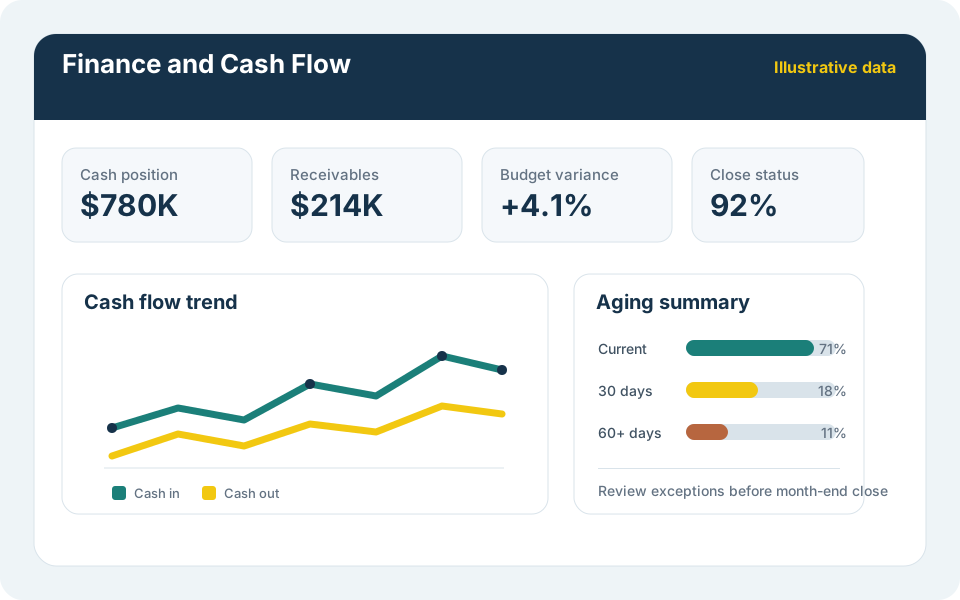
Revenue, profitability, work in progress, receivables, client activity, deadlines, and staff capacity.

Also relevant for property management, multi-location operations, logistics, delivery, dispatch, construction, project, and job-costing teams.

Illustrative Power BI distributor sales and margin dashboard concept
Illustrative dashboard — sample data.
Illustrative Power BI finance and cash flow dashboard concept
Reporting concept — illustrative data.
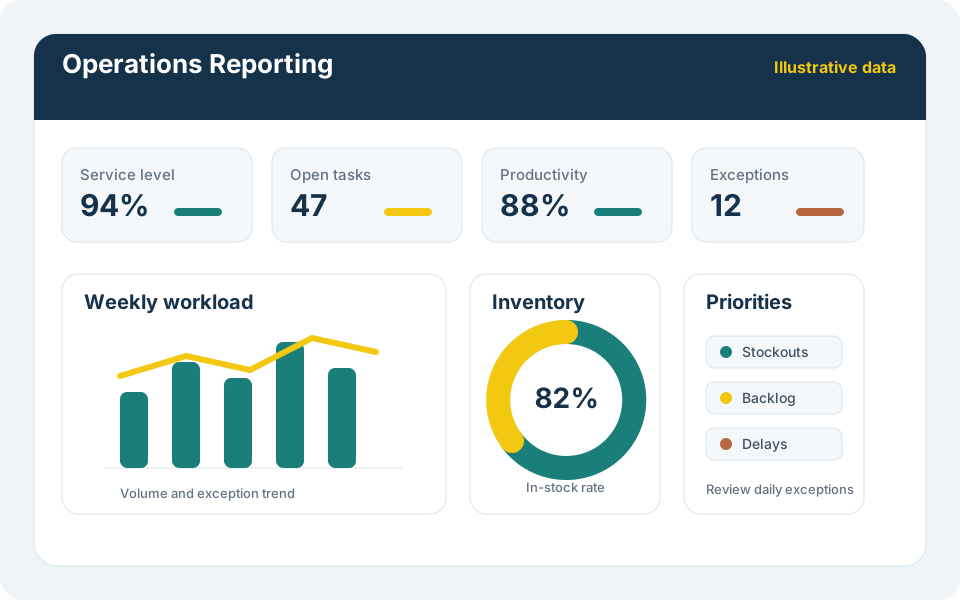
Illustrative Power BI operations reporting dashboard concept
Sample dashboard — illustrative data.

Example engagement

Example Reporting Gap Pilot

A growing service business manually updates weekly revenue, job status, and labor reports in Excel. NerdOrGeek reviews the current workflow, imports or connects the relevant data, builds a focused Power BI dashboard, validates totals against the existing report, and provides documentation so the team can maintain or expand it later.

This is an illustrative example, not a client case study.

Pricing

Start With a Focused Pilot, Then Add Support If Needed

Most businesses should begin with one defined reporting workflow. After launch, ongoing support is available for maintenance, troubleshooting, documentation, improvements, and additional reports.

Ongoing Reporting Support

Starting at $750/month

Monthly support after launch or for small reporting needs

Monthly support for maintaining dashboards, troubleshooting refresh issues, improving reports, reviewing calculations, updating documentation, and planning future reporting improvements.

  • Report maintenance
  • Refresh troubleshooting
  • Small dashboard improvements
  • Calculation review
  • Documentation updates
  • Data-quality checks
  • New report planning
  • Monthly reporting guidance

Ongoing support is a defined monthly capacity plan. It does not include unlimited dashboard builds, major integrations, or large multi-report implementations unless covered by a larger written scope.

Final pricing depends on report count, data quality, number of sources, calculation complexity, refresh requirements, documentation, integrations, support expectations, and stakeholder review cycles. Each engagement receives a written scope and estimate before work begins.

FAQ and contact

Ready to Improve One Recurring Report?

Do we need to know exactly what dashboard we want?

No. Most projects start with an existing report, spreadsheet, export, or recurring management question. The first step is identifying which report is worth turning into a dashboard.

Is this meant to replace hiring a data analyst?

No. The pilot is designed to solve one immediate reporting bottleneck and create a cleaner handoff for your team. Some businesses use it before a larger reporting investment; others use it to support an existing employee.

Can you work from Excel or QuickBooks exports?

Yes. Many MVP projects start with Excel, CSV, QuickBooks exports, or other files before moving into more automated connections later.

How do you keep pricing practical?

By starting with a defined scope, limiting the first project to one reporting workflow, and focusing on the dashboard, validation, documentation, and handoff that matter most.

Do you use AI?

We may use modern tools and AI-assisted internal workflows to improve speed, organization, and documentation quality. Sensitive client data should not be submitted to public AI tools, and project data handling is scoped to the engagement.

Please do not include passwords or sensitive business data in this form. Submitted information is used only to respond to your inquiry.